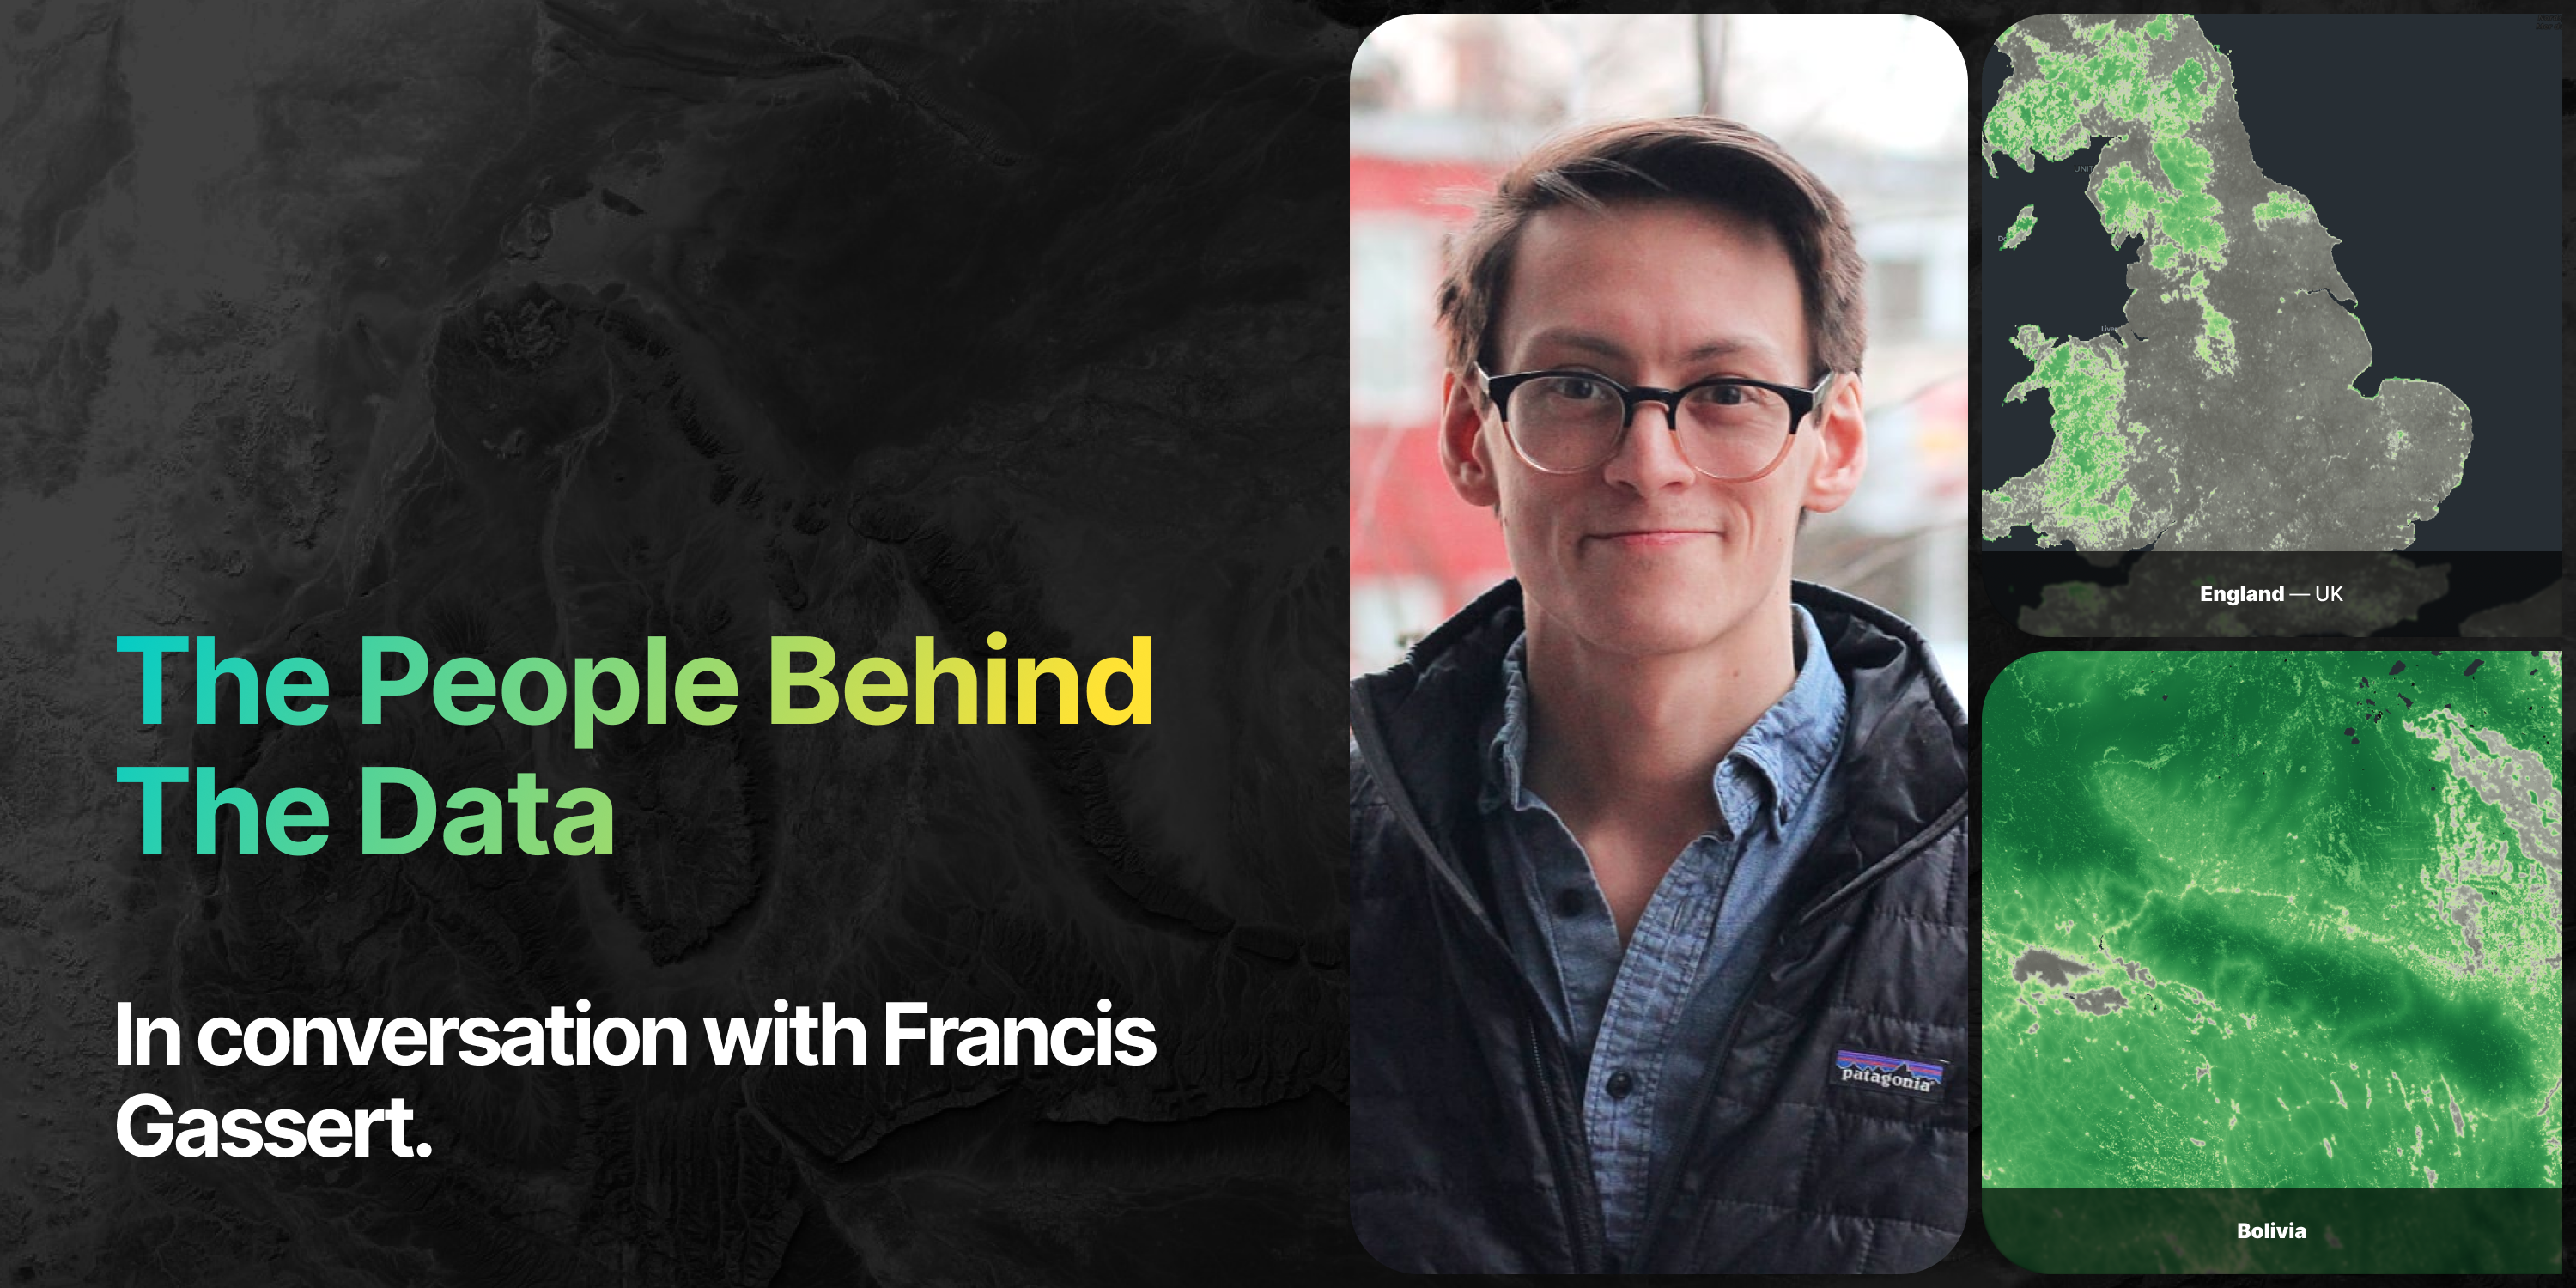
The people behind the data: In conversation with Francis Gassert.
On September 5th, Vizzuality released the Global 100m Biodiversity Intactness Dataset (v1.1) in partnership with Impact Observatory – an open-access tool tracking human pressures on nature made possible by the contributions of Francis Gassert, Sam Hyde, Joe Mazzariello, Steve Brumby, and Michael Harfoot.
Because people are at the heart of every great project, we sat down with Francis Gassert, Vizzuality’s Strategy & Impact Lead, to zoom in on who was behind the data. In this Q&A, he breaks down the origins of the Biodiversity Intactness Index, why open data creates impact, and shares his excitement for technology enabling better conservation.
...
Q: What is your relationship to open data, and why have you become such a strong advocate for it?
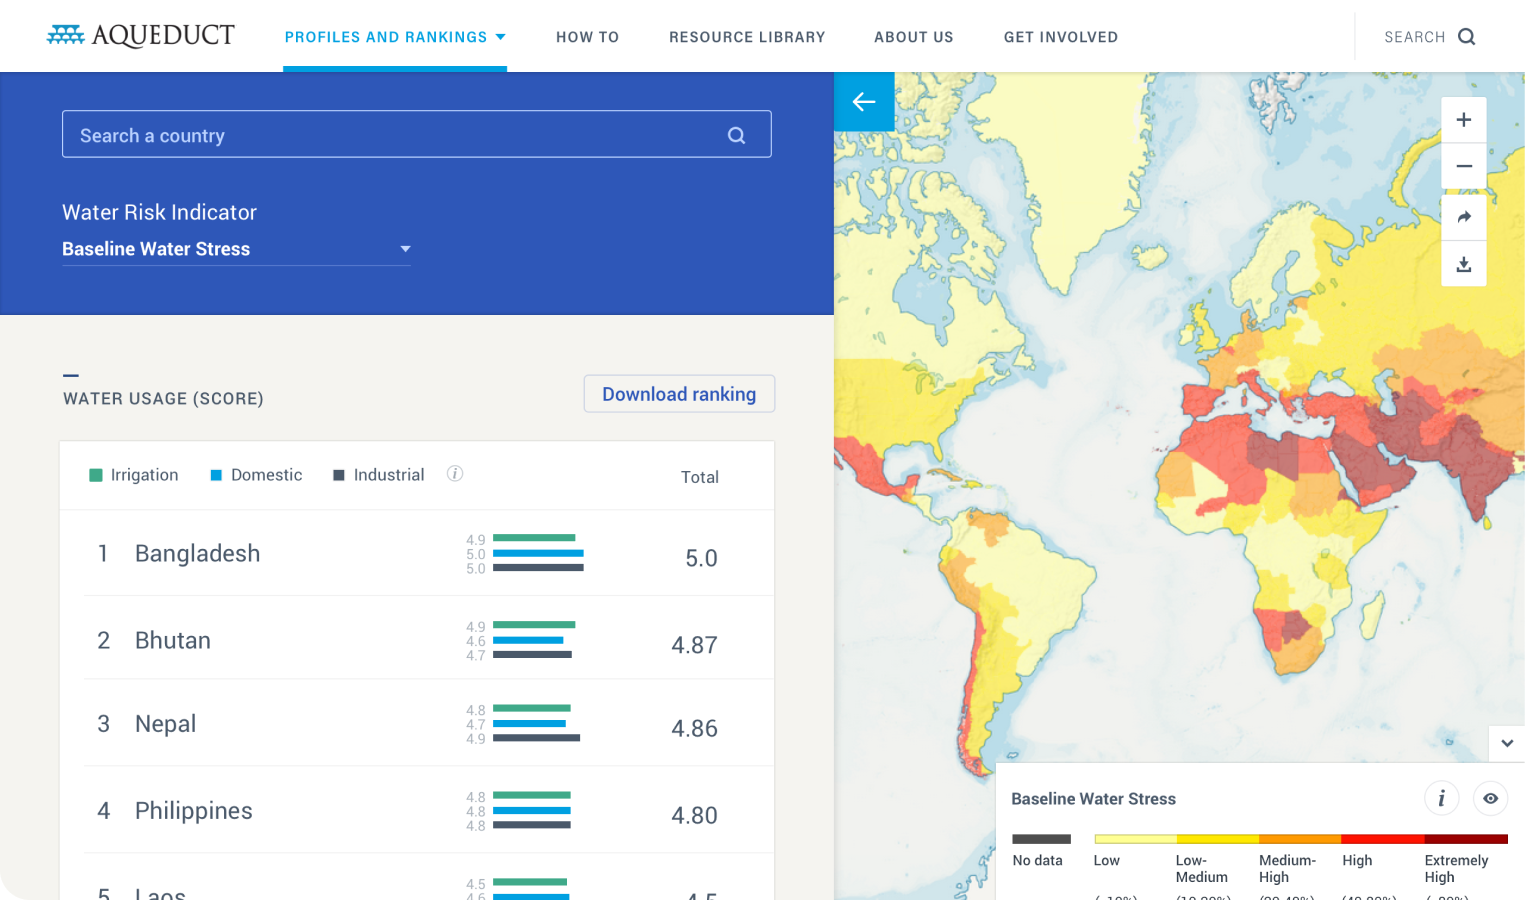
Francis Gassert: I started my career in this sector on a project called Aqueduct at the World Resources Institute (WRI). The idea behind this project was that a huge amount of financial capital is dependent on freshwater for operation—power plants, data centers, factories, etc.—, and if we can get companies to pay attention to this they would start paying attention to climate change.
At the time we had many discussions about whether we should place non-commercial restrictions on the data we were producing. Big corporations benefit from this data and can afford to pay for it, and we need to sustain the work to keep it up to date. I think a lot of NGOs and academics have this mindset. But if the purpose of your work is to change society, it just makes no sense at all. Why restrict the very people you want to influence from accessing your work?
We made Aqueduct data open, and I’m convinced it was the right choice both from the impact perspective and from a financial sustainability standpoint. By 2018, 300 of the largest corporations filed investor reports on water risks based on Aqueduct. In 2025 nearly 10,000 companies disclosed water related risks and impacts via the Carbon Disclosure Project. The Aqueduct team continues to publish new research.
Open data also feeds an ecosystem of science and innovation. The Biodiversity Intactness dataset is built on a half dozen other open datasets and observations aggregated from scientific publications.
Nature is deeply complex, and we need better ways to monitor it. We need more field data, more open science, and an ecosystem of professionals, startups, and consultants incorporating this knowledge into corporate and government behavior.
Q: What is the story behind the creation of the Biodiversity Intactness Index?
Francis: The idea behind these maps came about quite a few years ago. After recognizing the value of satellite-based global deforestation monitoring, a group of organizations, including the World Resources Institute, Google, and National Geographic Society had teamed up to build a new high-resolution global land cover monitoring system. If we can monitor all types of human land uses, we can then see the sources and drivers of change. Are forests and prairies turning into agriculture? Where are natural areas returning?
The Impact Observatory team, coauthors on this dataset, recognized that land cover was also a key input for several scientific models measuring human impacts on biodiversity. So if we can monitor land cover, we also have the potential to model impacts on nature at a high resolution.
.gif)
Q: Why are the results important to you – and to others?
Francis: Nature is fundamental to modern society. Both in the obvious ways that we depend on nature for food production, clean water, and natural resource provision, as well as the spiritual, philosophical, or scientific insight we gain from beholding all that the universe has yielded on Earth. Attempts to qualify the economic value we derive from the practical uses of nature number in the hundreds of trillions of dollars per year, while half of global GDP is directly dependent on nature.
Yet the efficiency of modern society also detaches us from how we depend on and influence the environment. And, as a result, the natural world is disappearing across indicators, species extinction rates, species populations, wilderness areas etc.
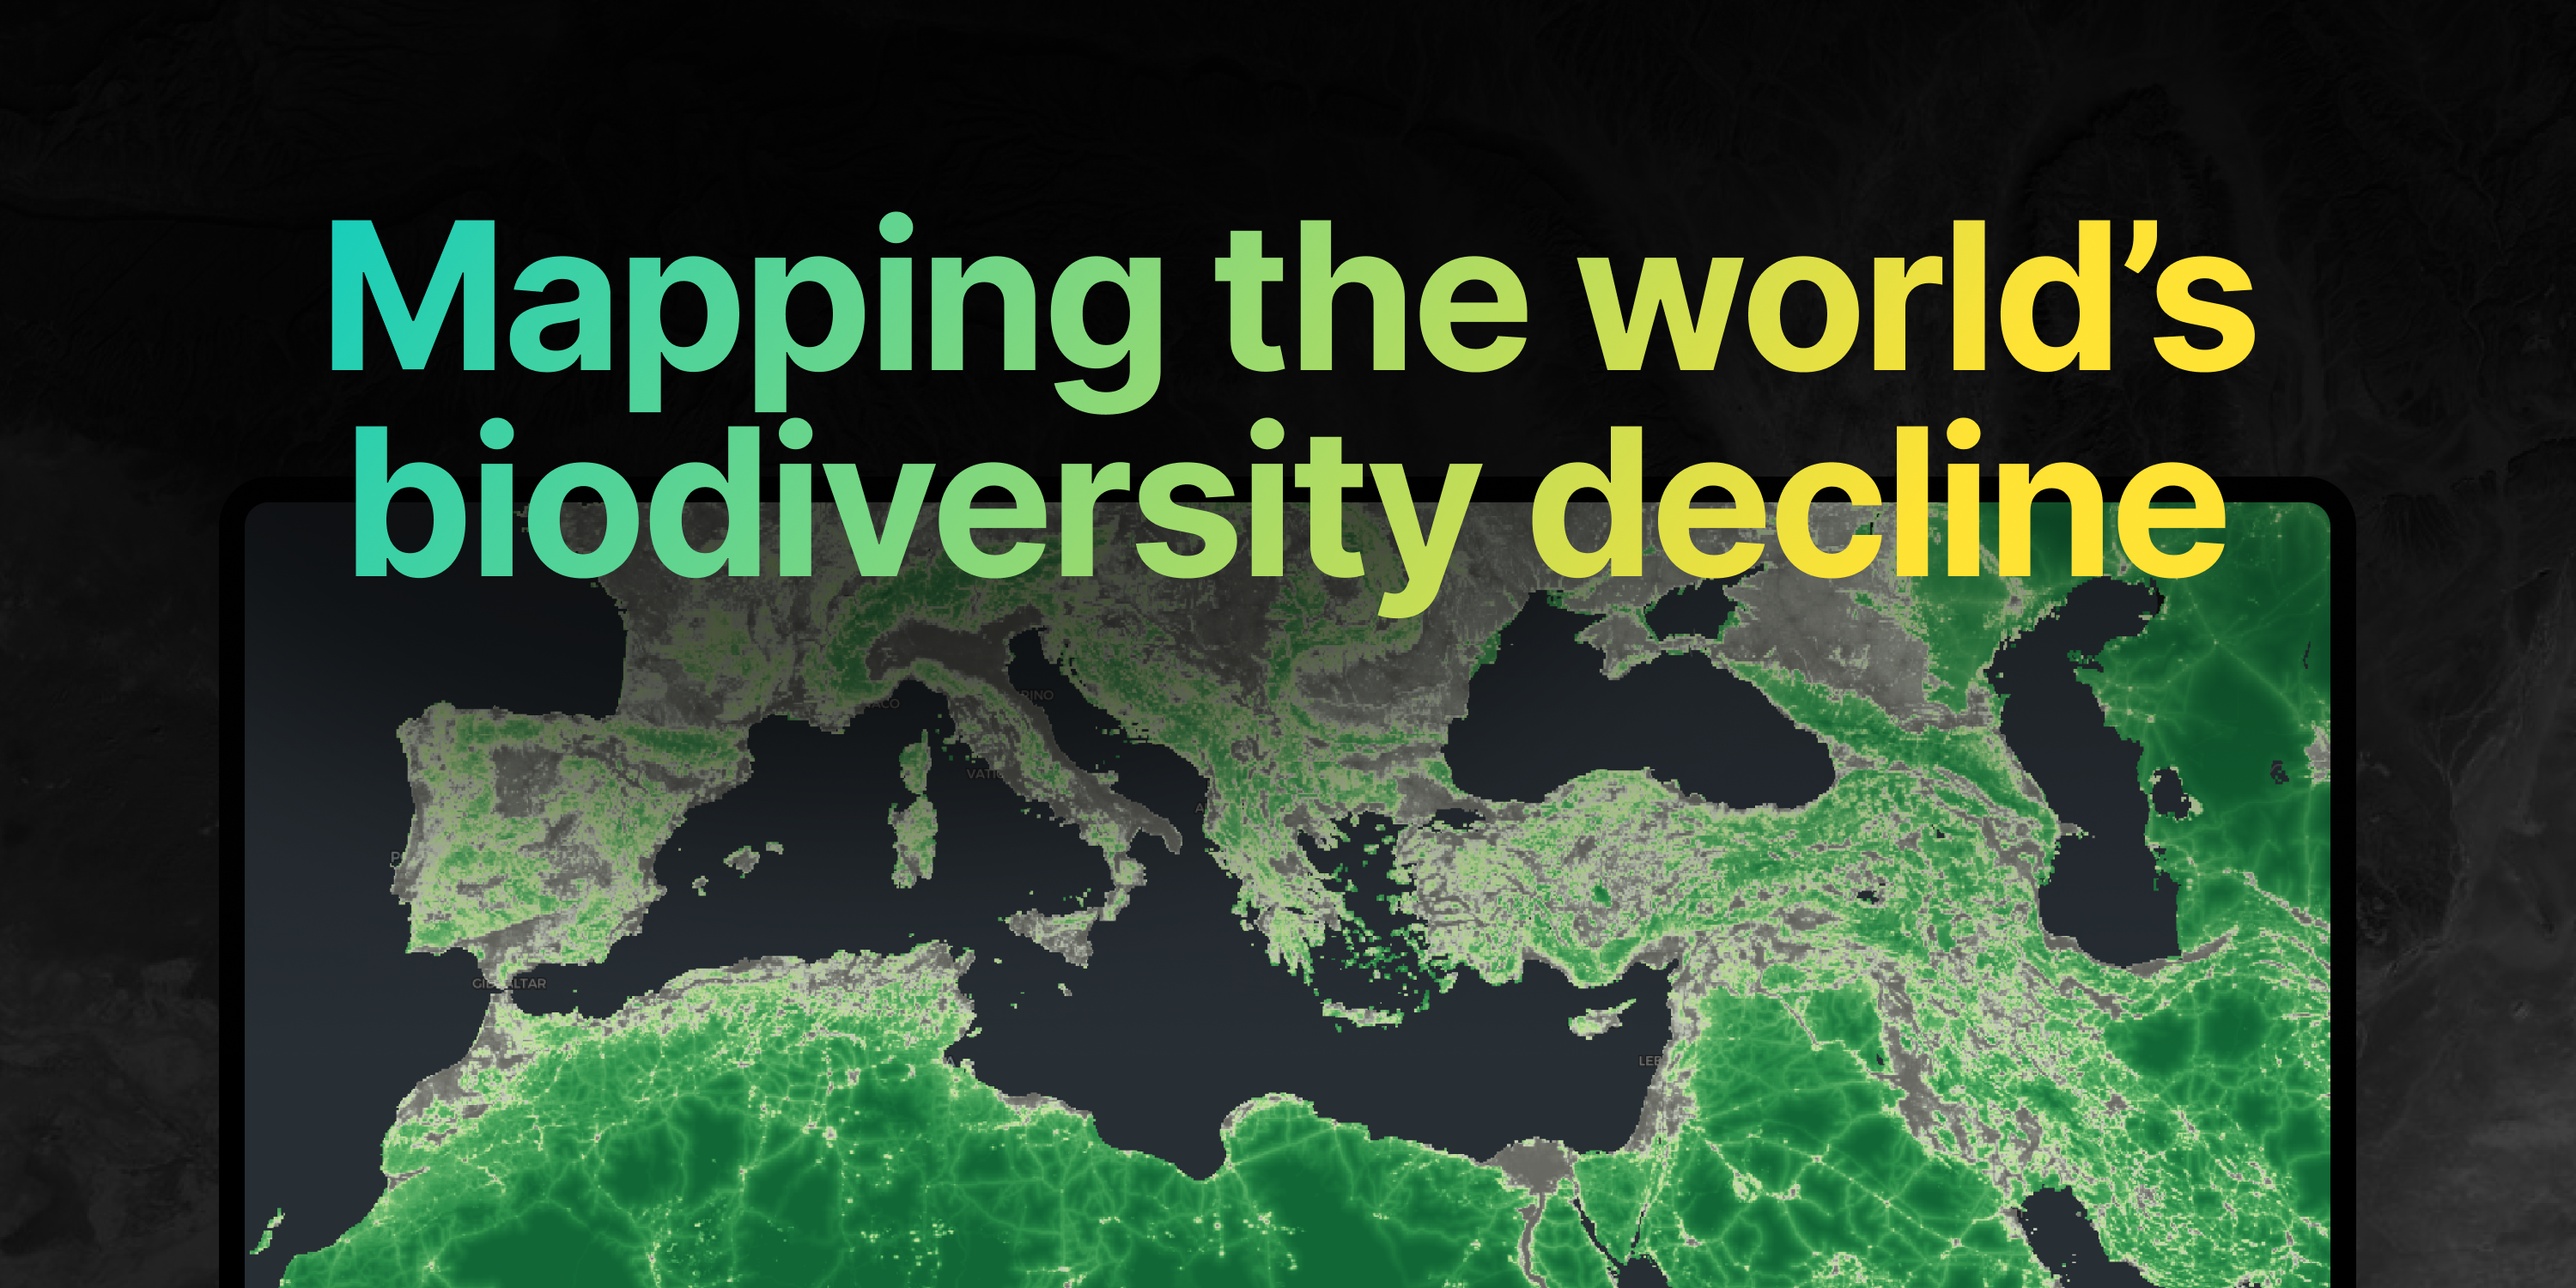
These maps show the patterns of how human-dominated landscapes are displacing natural ones, and where we are giving land back to nature. They can be used to understand large scale trends of impacts on biodiversity, and provide an indication of likely conditions at a finer scale.
Q: Why did Vizzuality and Impact Observatory choose to publish this dataset openly?
Francis: A lot of our work at Vizzuality revolves around making scientific data more accessible. If we present information in the right format, people pay attention to the issue, they use it, and they make better decisions. And the more people we can get to use the information the greater impact we can have. Most of our business is built on other people’s open products. This is one way in which we are contributing back to the community.
Q: What do you hope to achieve with the publication of this dataset?
Francis: Following the adoption of the UN Global Biodiversity Framework in 2022 there’s been a burst of momentum to halt and reverse the loss of nature. In the private sector, initiatives such as the Taskforce on Nature-related Financial Disclosures (TNFD) have set standards for corporations, banks, and investors.
Yet, through years of industry pilots, TNFD has found that accessing data continues to be a key barrier to action. Data access should not be an excuse for corporations to delay evaluating their impact—and reliance—on nature.
We also need to make it more obvious where and how we are losing nature for people to know where to prioritize and how best to respond. These maps are far from perfect, but they’re a step in this direction towards global monitoring of the state of nature.
Q: Looking forward, what related technologies or projects excite you most?
Francis: I’m excited about applications of newer machine learning techniques to biodiversity monitoring. In the past we’ve always done things categorically, e.g. is this satellite pixel a forest or not? Is there an animal in this photo? But there’s so much more information in a photo or video than you can describe with a few labels. If you take a photo of a field, what can you guess about the biodiversity of that space? How does a healthy ecosystem look different than a degraded one in satellite imagery over the course of a year? I had the opportunity to collaborate on a paper on the potential for AI for Nature last year, and the field is advancing incredibly quickly.
...
Many thanks to Francis Gassert for sharing his reflections with us, and to the co-authors of the “Global 100m Projections of Biodiversity Intactness for the Years 2017–2025”, Mike Harfoot, Joe Mazzarello, and Samantha Hyde.
- Link to the open-access dataset.
- Link to the methodology paper.
- Link to the source code.
%20(3).png)